
Report English
Global Shopping Insights Report: Spain 🇪🇸
Consumer habits in the world spotlight


Battle of the drinks: juice or water?
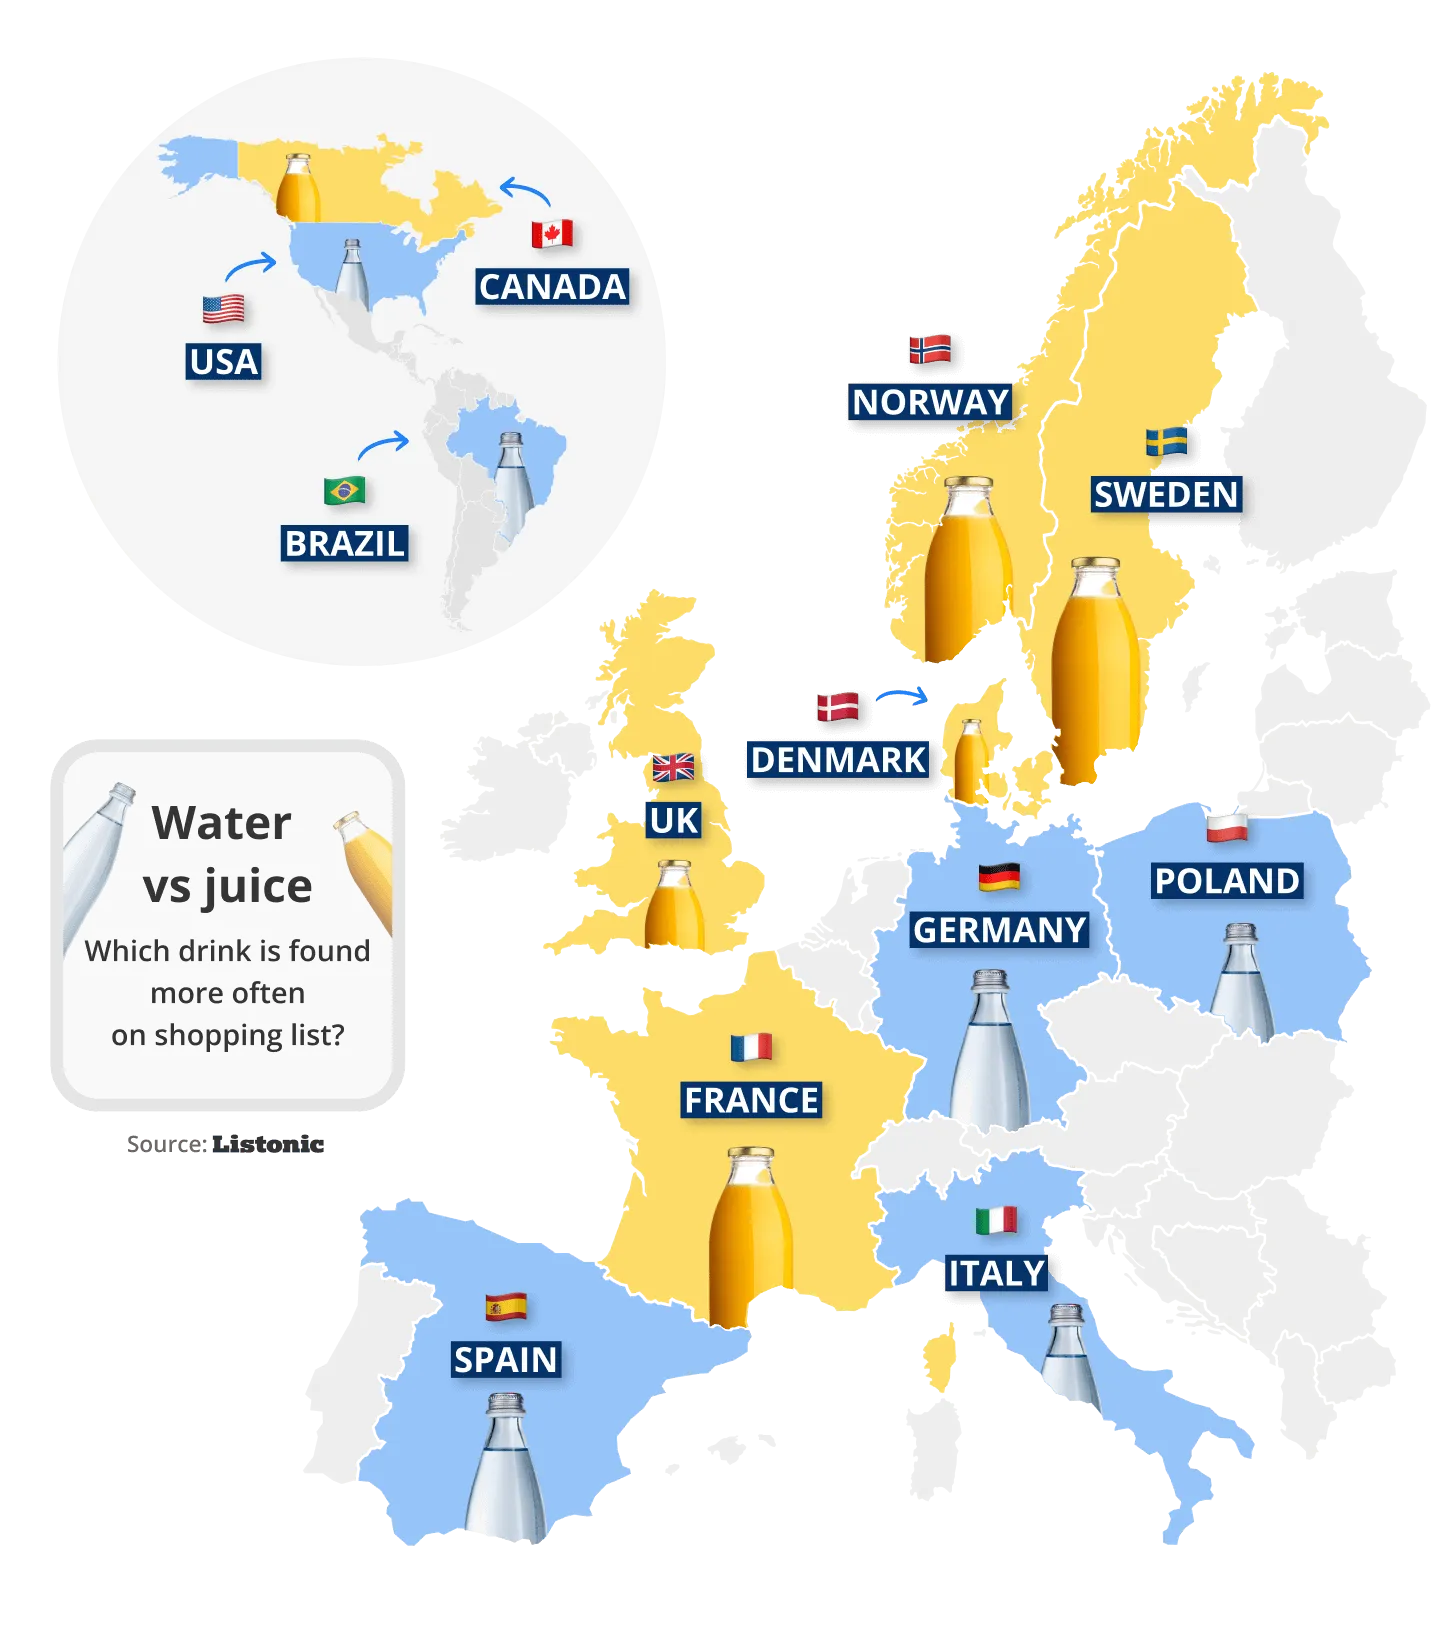
In Spain, water is chosen significantly more often than juice, with 109% more additions of water to shopping lists compared to juice.
Water is more frequently planned for purchase by Americans, Italians, and Germans, while juice is preferred by the French and Norwegians.
Which country likes Nutella the most?
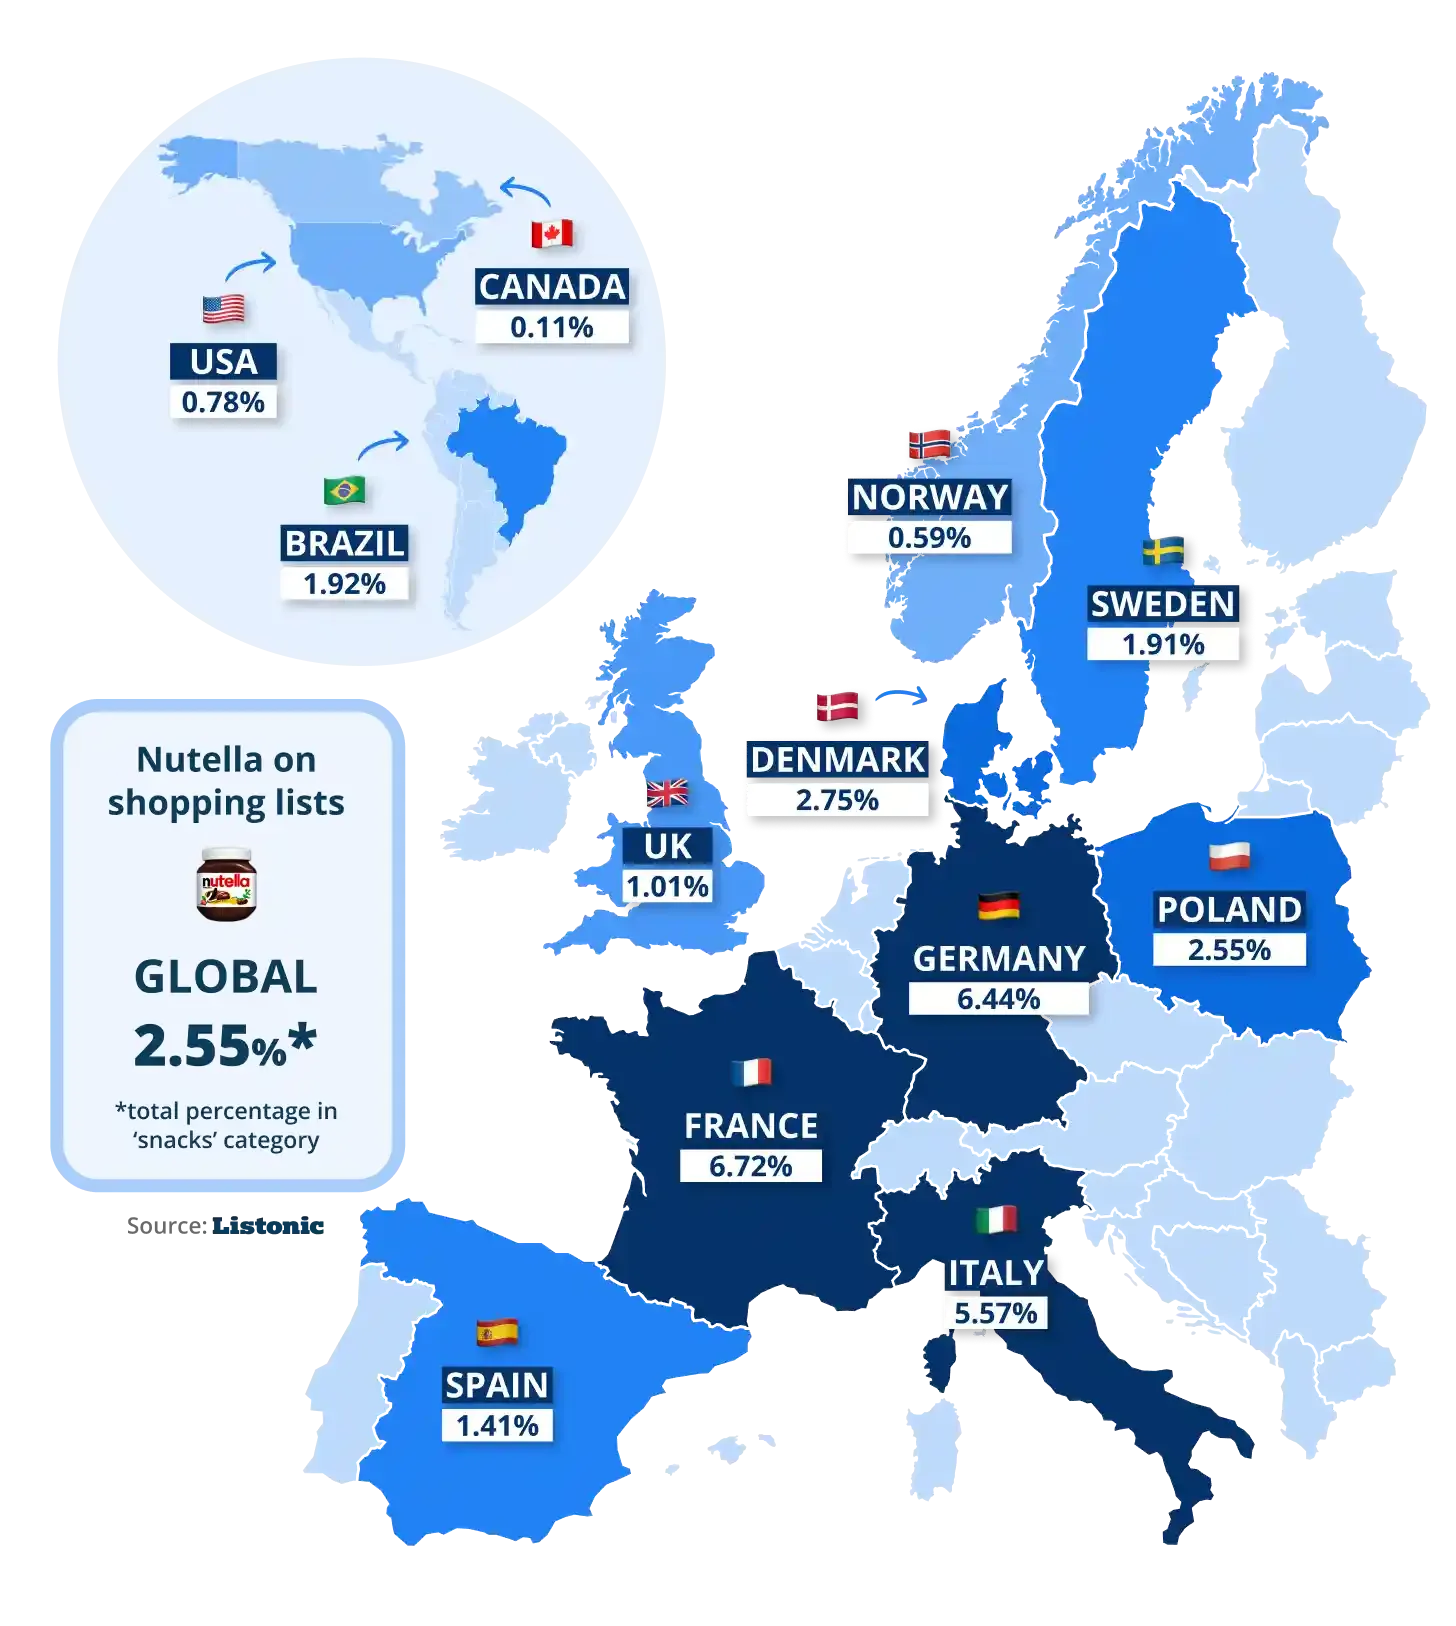
Spain ranked eighth in the share of Nutella in the sweet and savory snacks category. The highest results were recorded in France and Germany, while the lowest were in Canada, the USA, and Norway.
"shopping" or Mercadona? Most common shopping list names
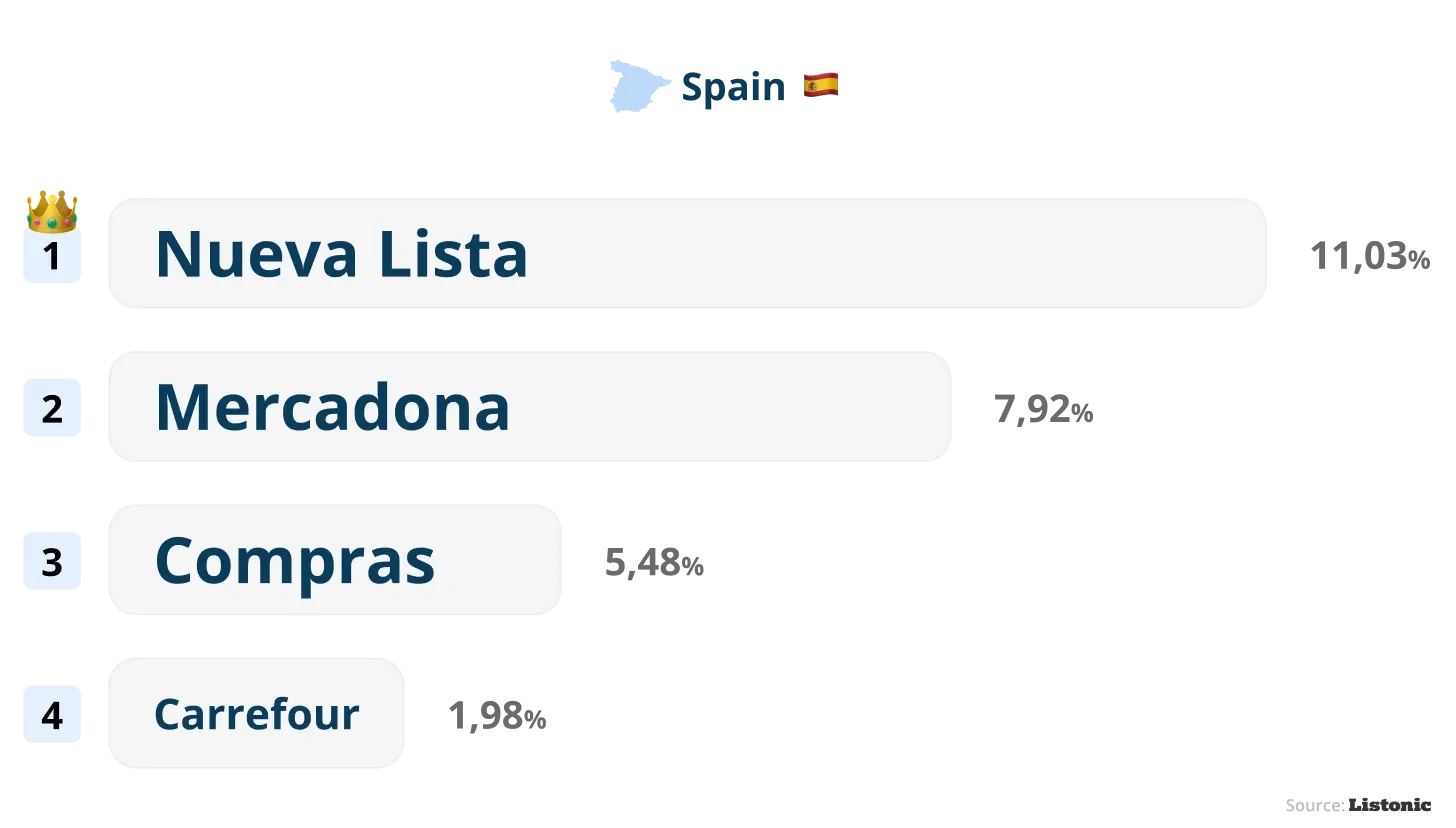
The most popular phrase in shopping list titles in Spain was "new list," appearing in 11.03% of lists. However, what truly distinguishes Spanish shopping lists is the exceptionally high presence of retailer names. "Mercadona" alone appeared in 7.98% of shopping list titles, surpassing the simple term "shopping" and all retailer mentions in both Italy and France.
In total, retailer names accounted for over 15% of shopping list titles in Spain, the highest among all analyzed countries.
Who’s behind the shopping list?
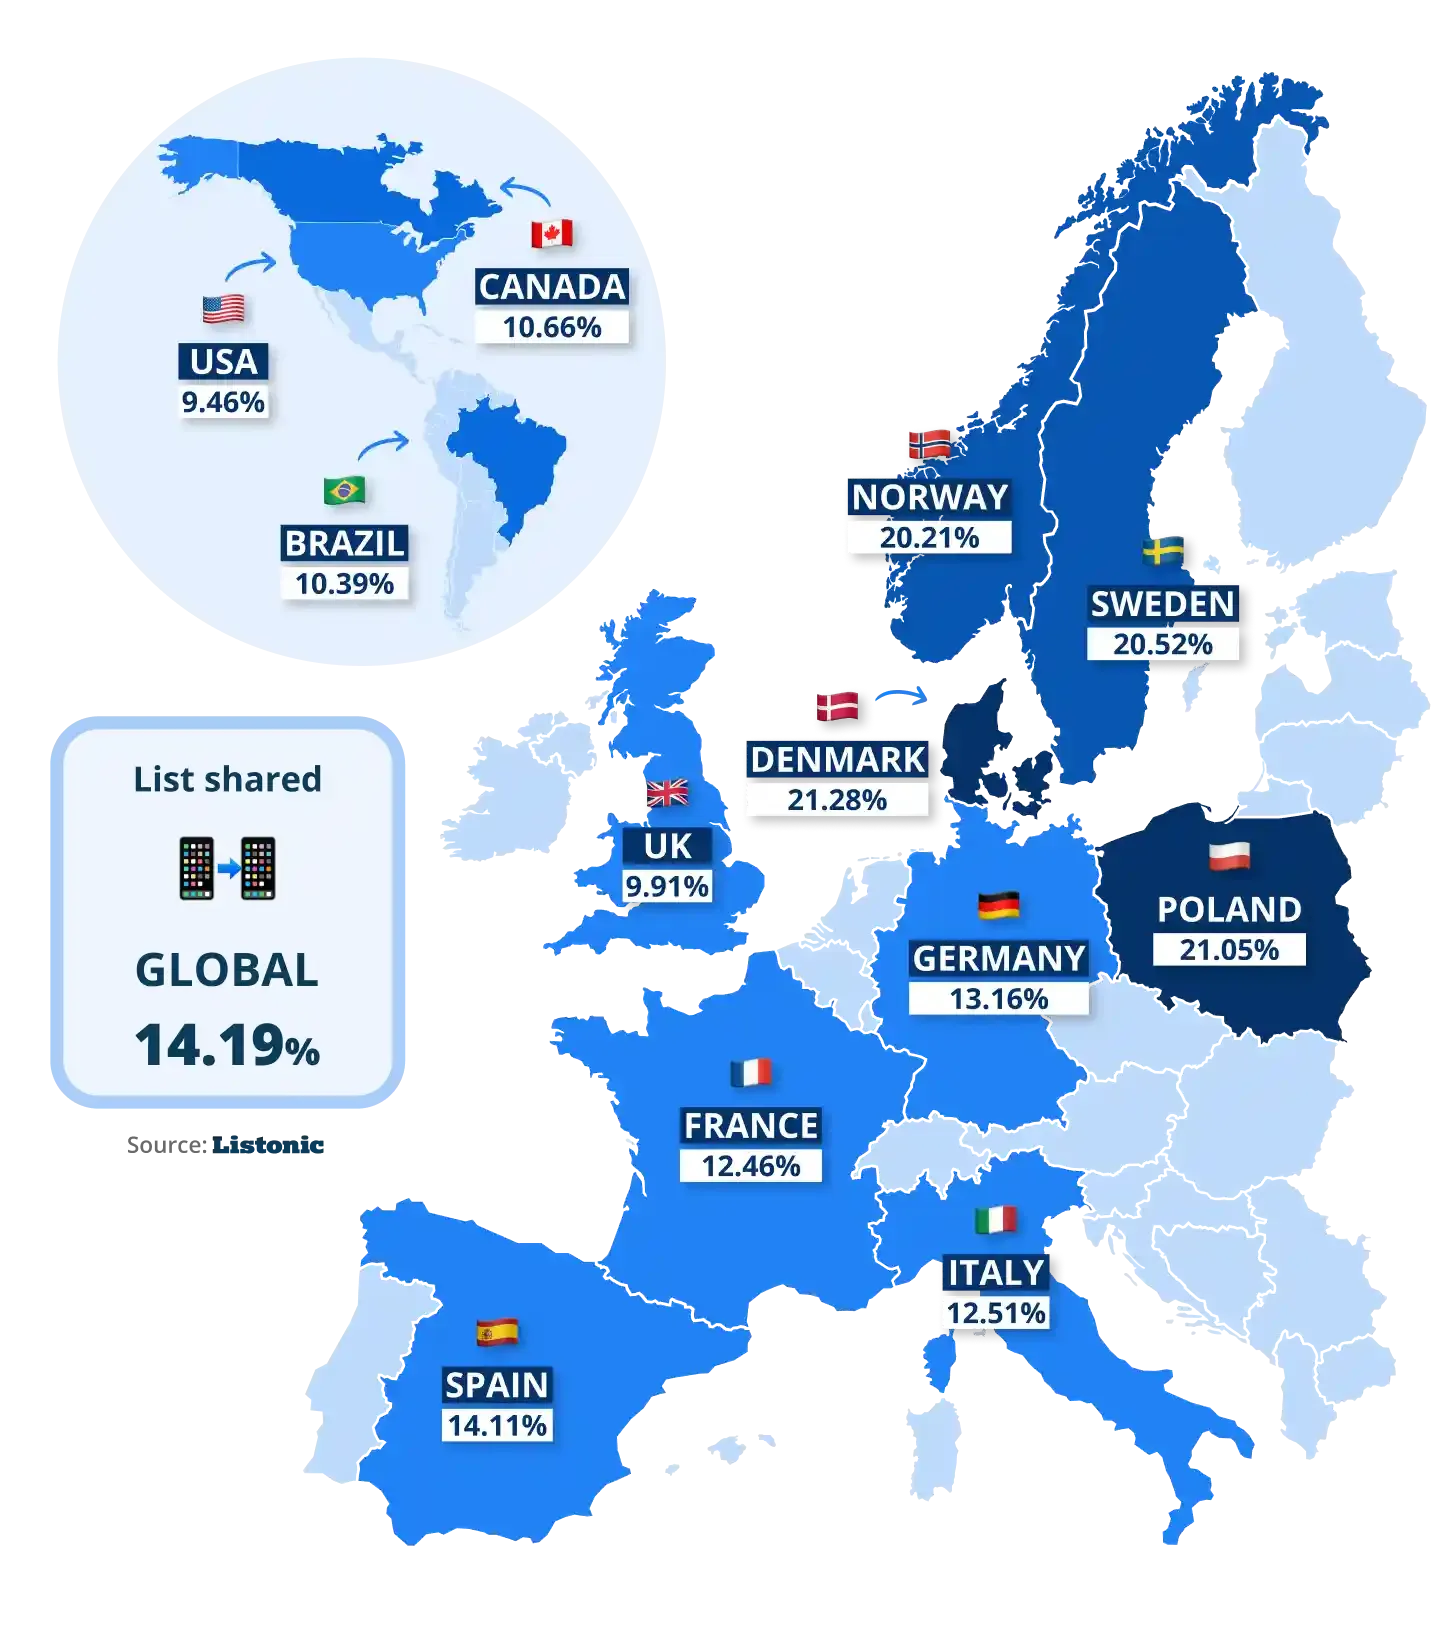
In Spain, 14.11% of active shopping lists from June 1, 2023, to May 31, 2024, were shared with at least one person.
This result is slightly below the global average and ranks fifth among the analyzed countries. Only Danes, Poles, and (slightly) Swedes had higher sharing rates. Americans used the list-sharing feature the least.
The list-sharing rate may reflect how citizens of a given country share the responsibility of household shopping.
Hot categories
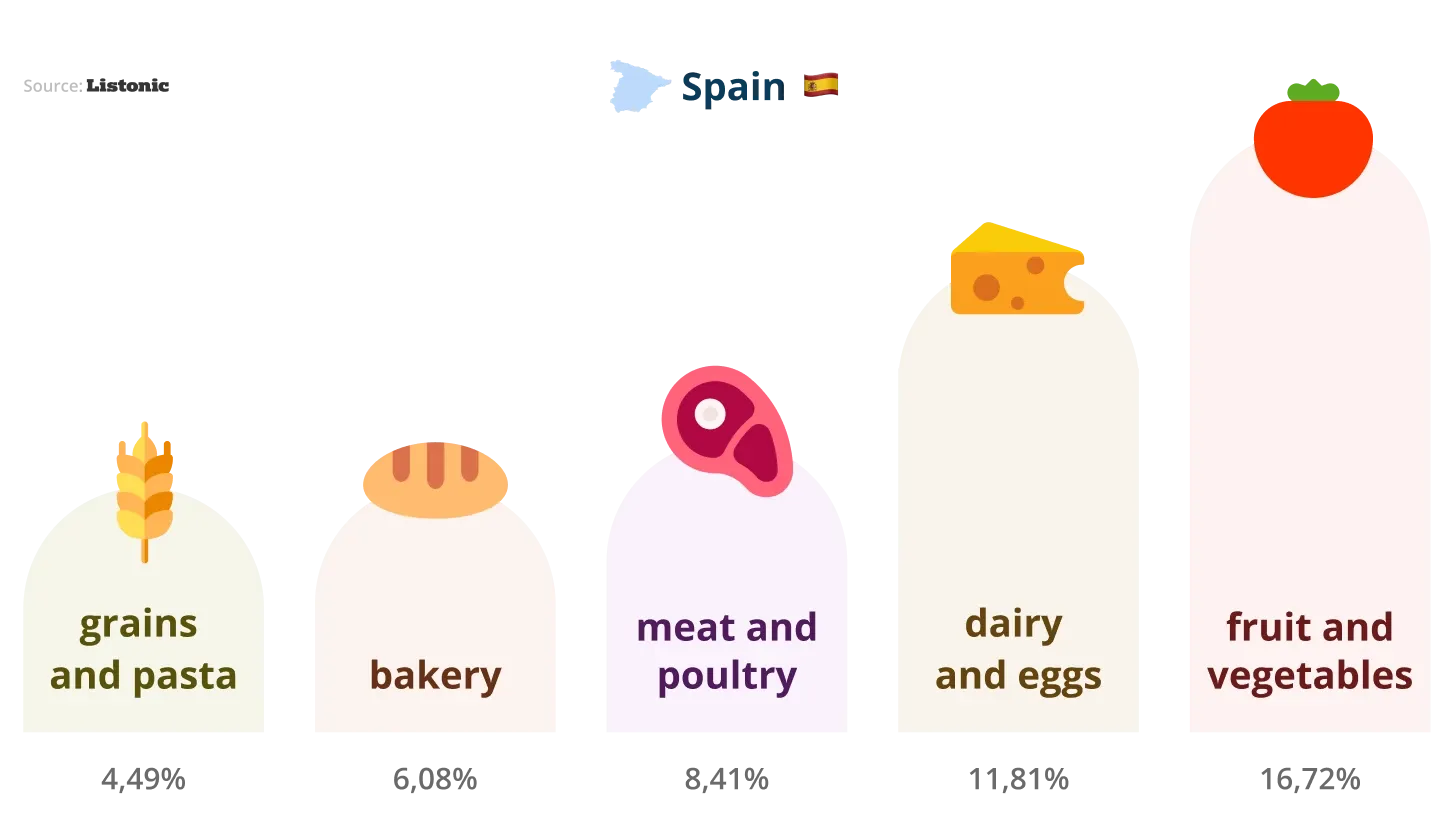
Spanish shopping lists feature a relatively low share of fruits and vegetables, accounting for 16.72%, which is below the global average (18.57%) and significantly lower than the leader, Poland, which reached 22.86%.
This may be due to the different shopping habits in Spain, where the wide availability of fruits and vegetables and the popularity of local markets lead to more spontaneous purchases, with users less likely to add these items to their shopping lists.
However, Spain stands out for its high share of meat and cold cuts on shopping lists. With 8.41%, it has the highest result among the analyzed countries, surpassing the global average of 7.91%.
Shopper favorites
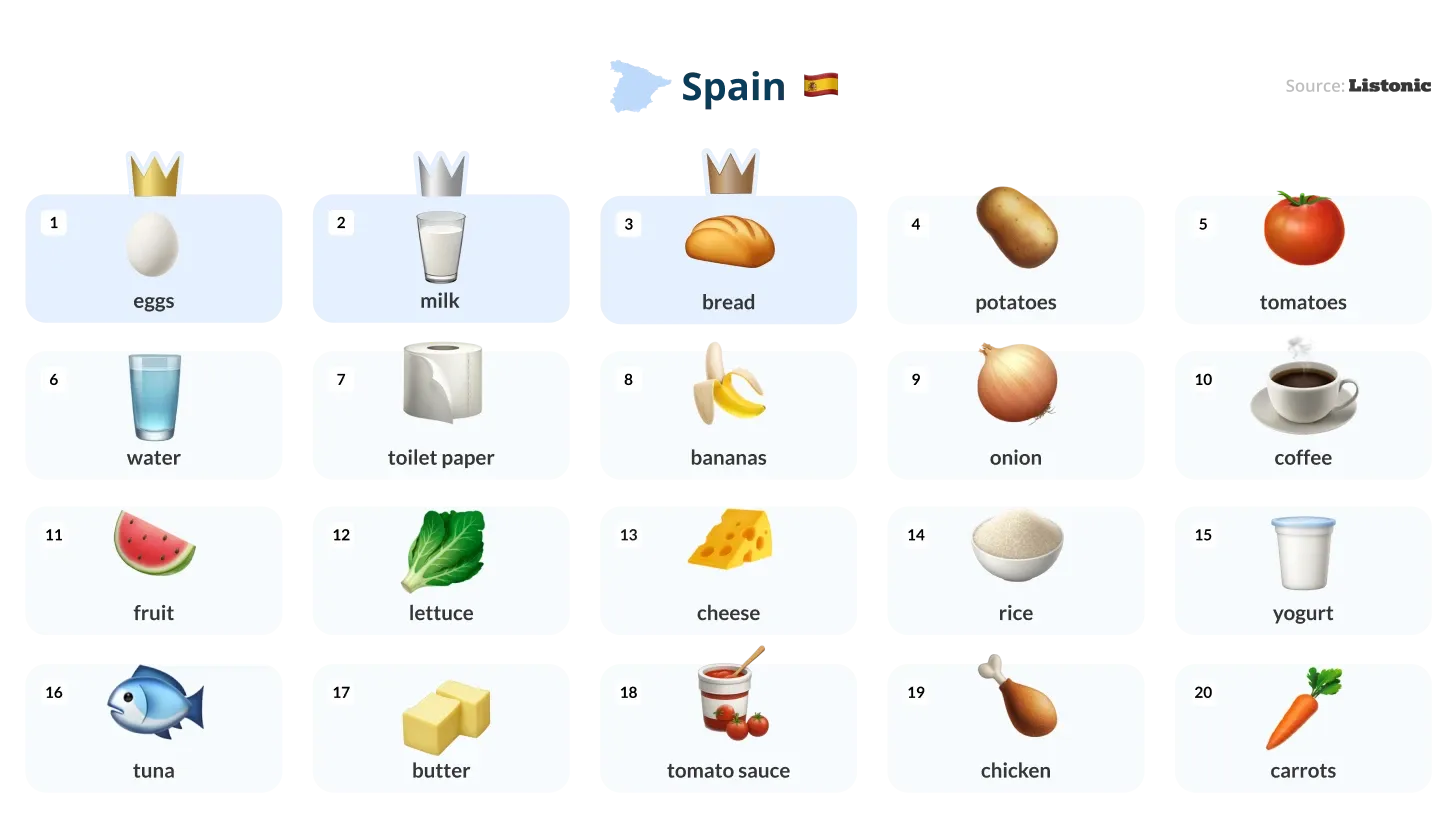
Eggs, milk, bread, and potatoes are the most frequently added items to shopping lists in Spain. Among the analyzed countries, only in Spain and Italy were eggs added to lists more often than milk.
Spanish shopping lists also stand out with the high ranking of coffee, which holds 10th place. Only in Brazil did coffee rank higher, in 5th place. Similar to Italy, Spanish lists feature zucchini and tuna in the top 20, items that are not as popular in other countries.
Who shops like a pro?
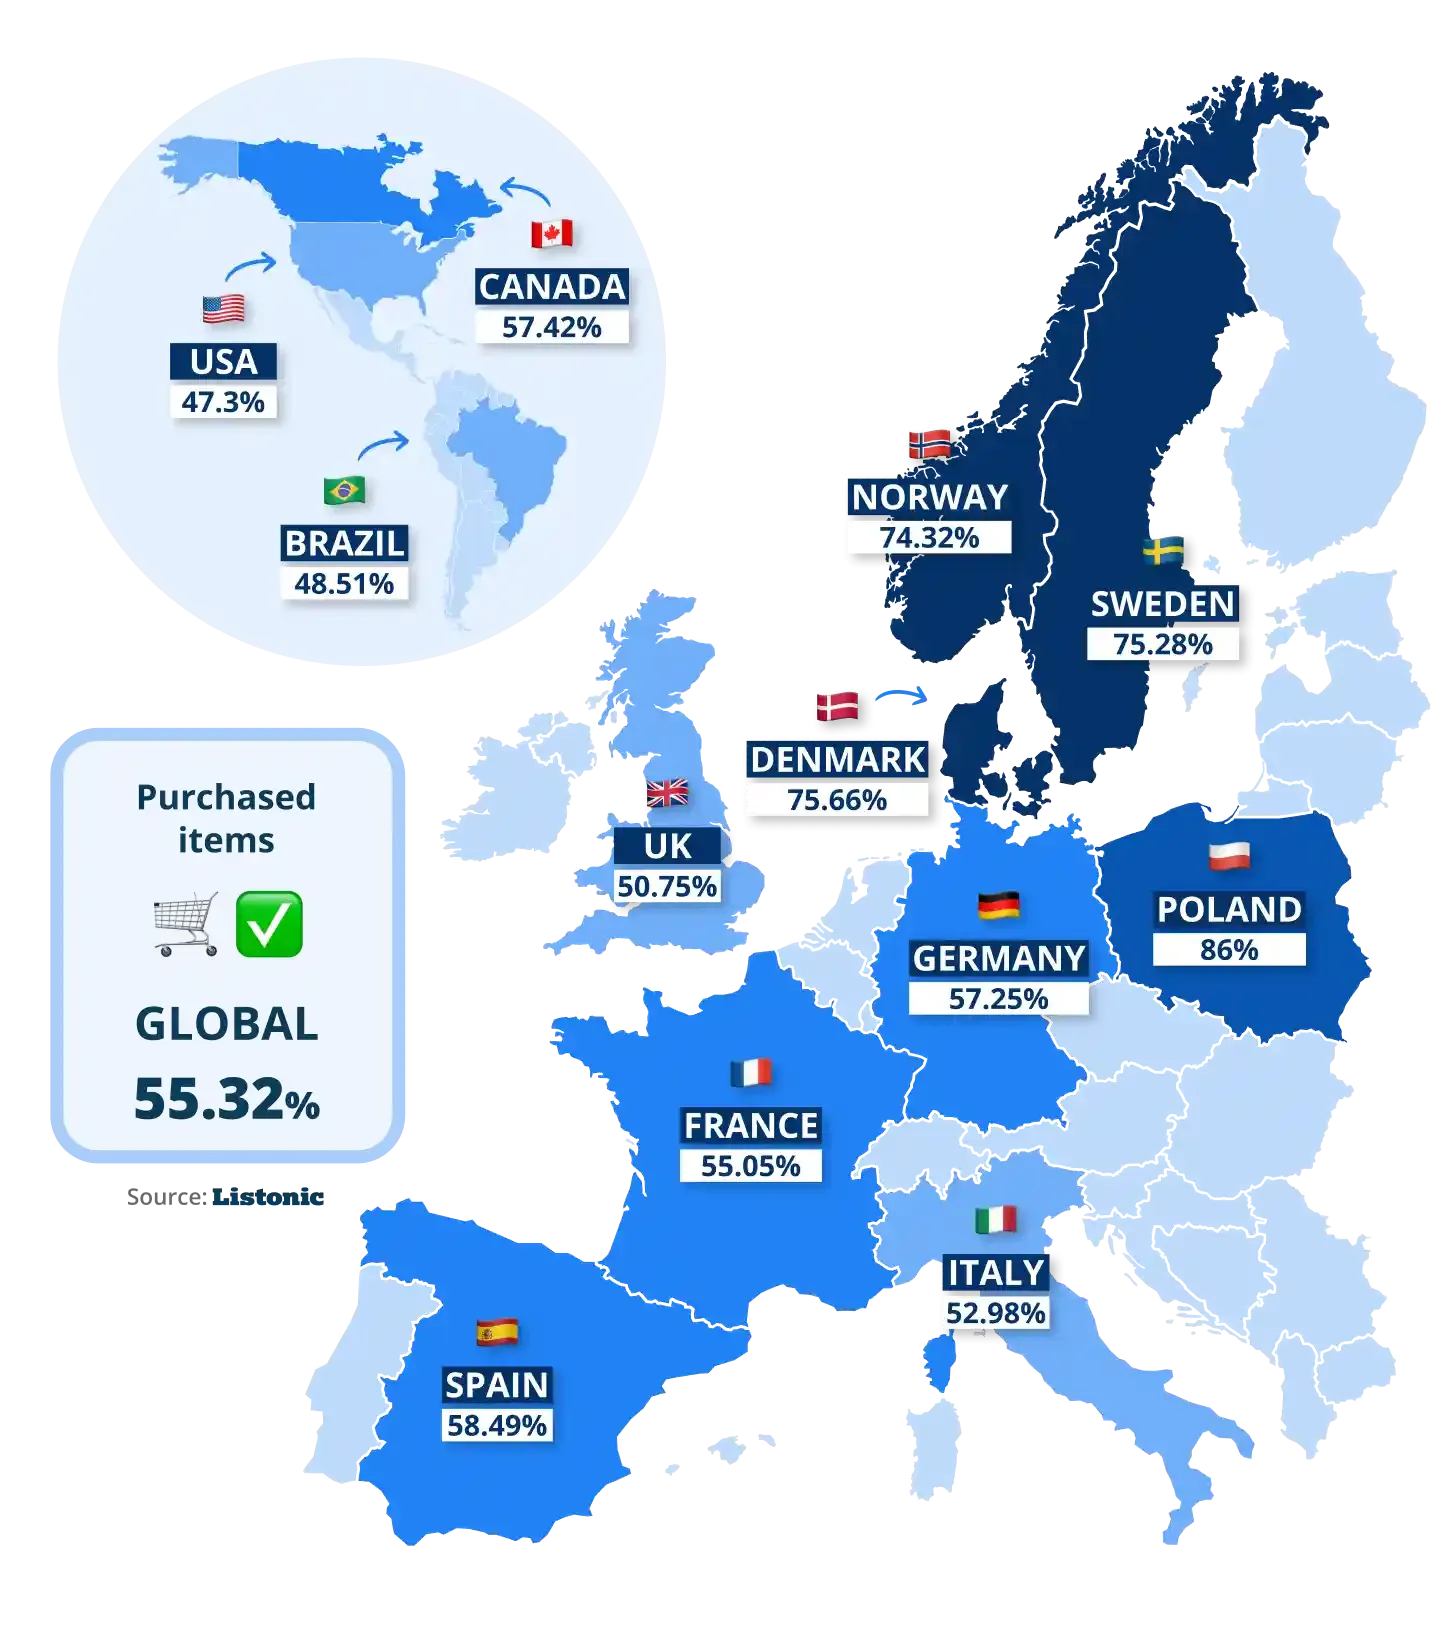
In Spain, 58.48% of items on shopping lists were marked as purchased after being added. This result is close to the global average and ranks Spain fifth out of the 12 analyzed countries.
The lowest rates were recorded in the United States (47.3%) and Brazil (48.51%).
Factors such as store availability and product offerings may influence the rate of items being marked as purchased.
Sweet tooth or snack attack?
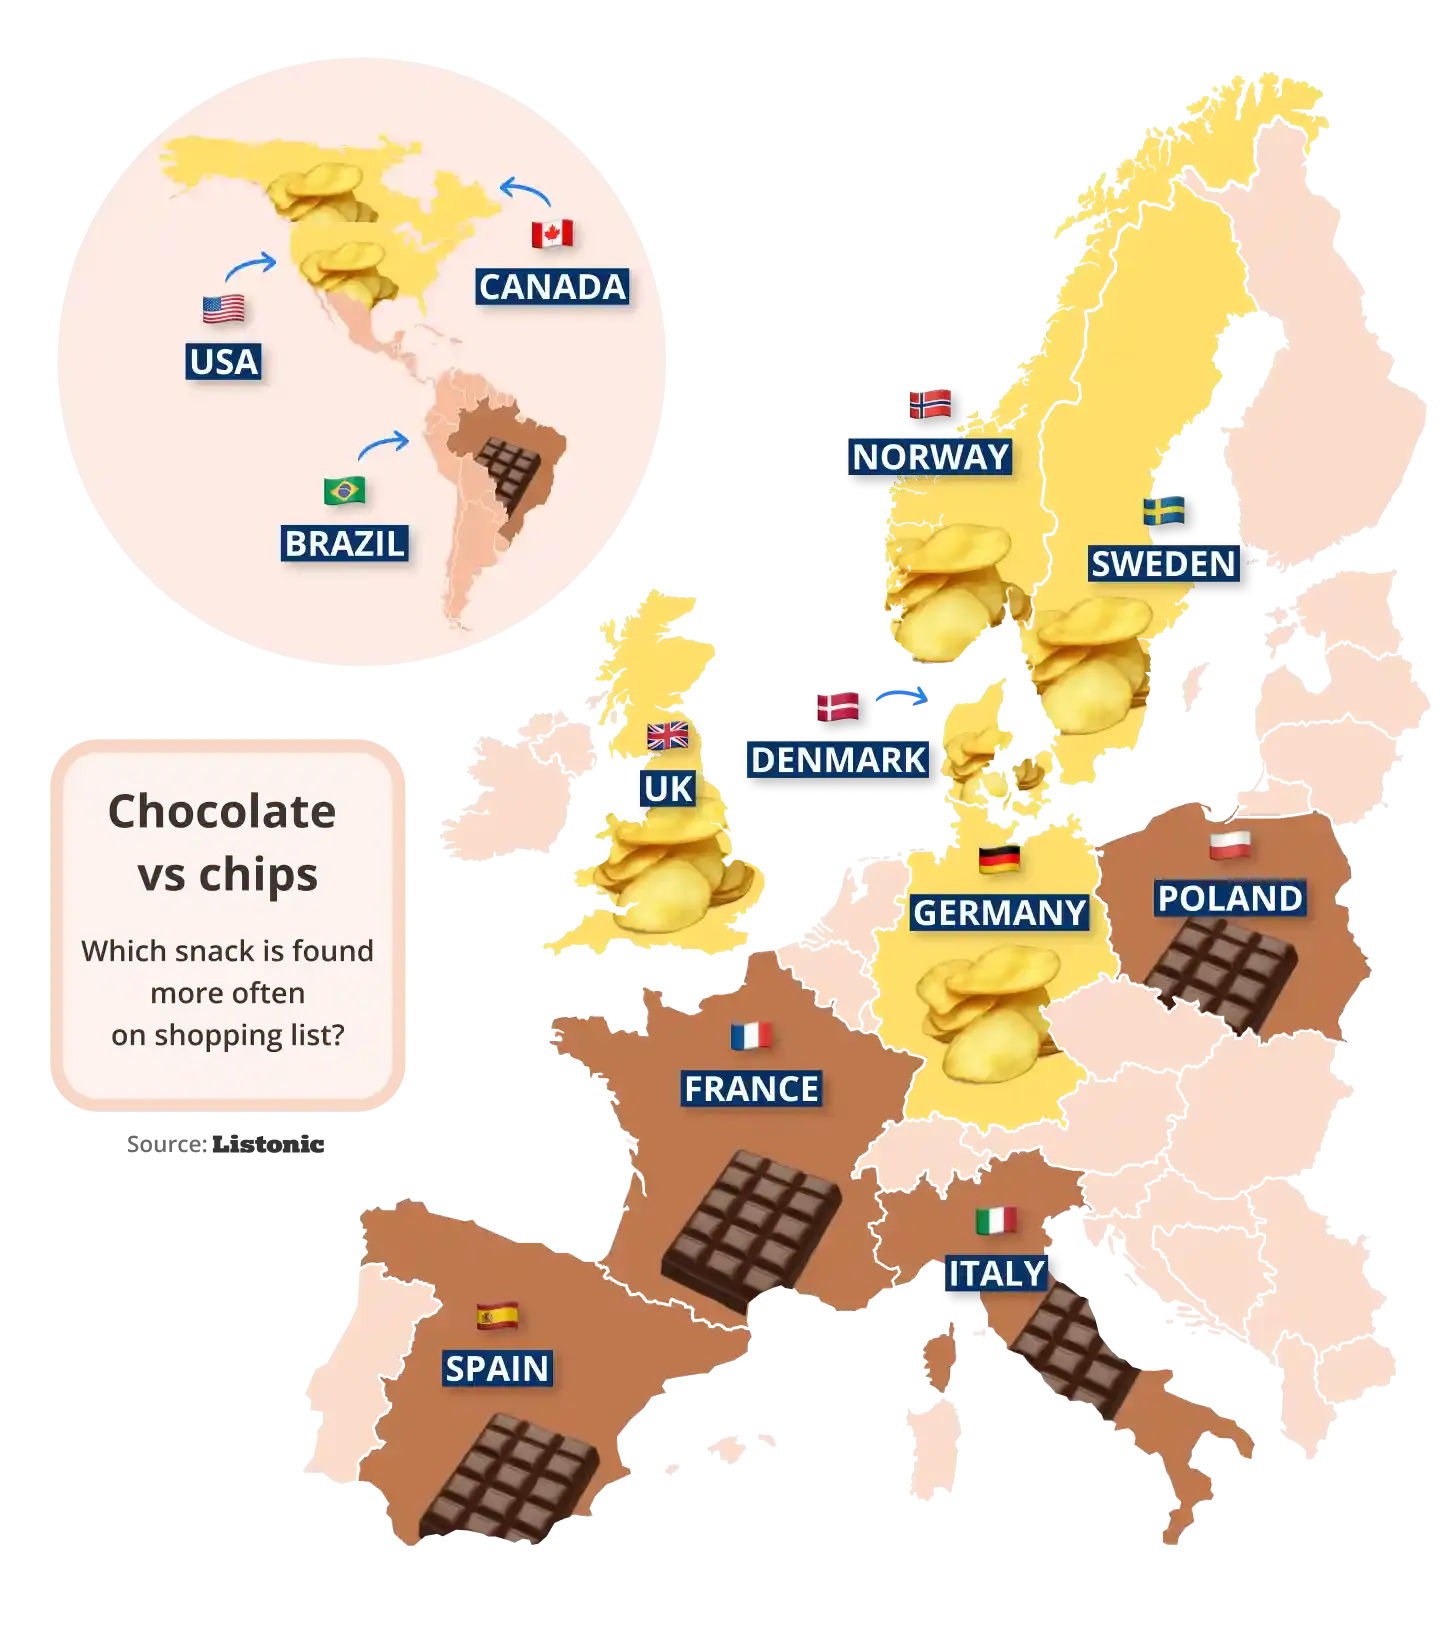
Spaniards choose chocolate significantly more often than chips, with a 47% preference for chocolate.
Similarly, chocolate is more popular in Italy, Poland, and France. In contrast, chips are more frequently added to shopping lists in Germany, the UK, and Canada.
Loved in Spain
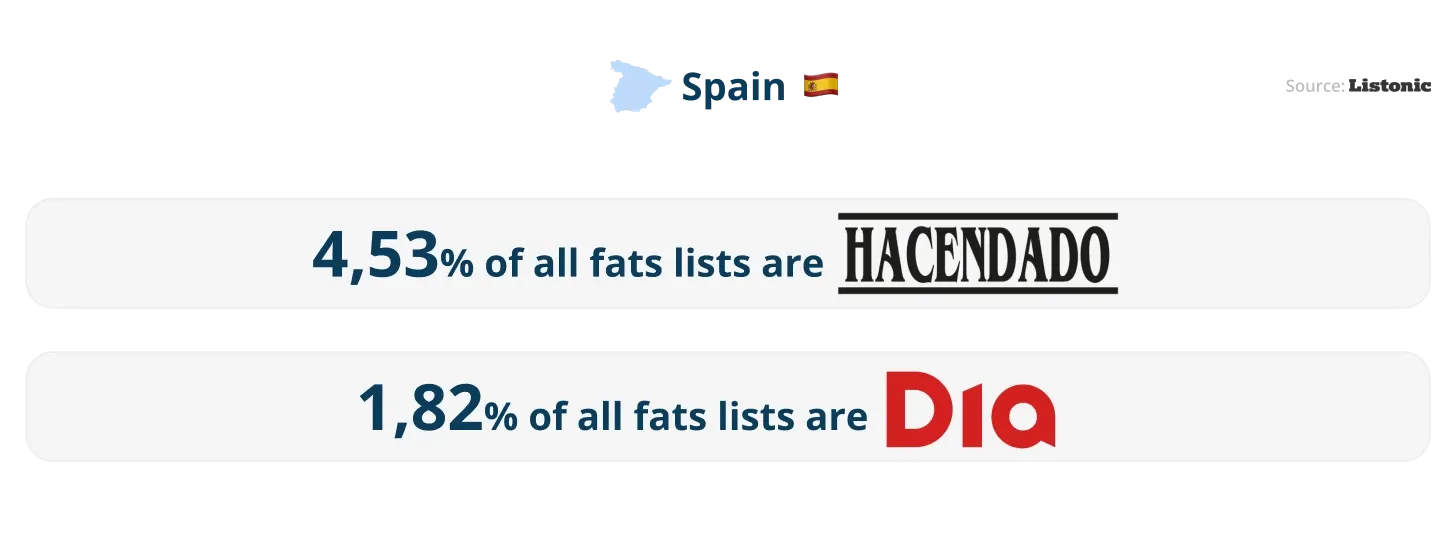
The Hacendado and Dia brands, known for their olive oil, enjoy significant trust among Spaniards. Respectively, 4.53% and 1.82% of all fats on shopping lists are products from these brands.
Choosing specific brands, such as "Hacendado olive oil," indicates brand loyalty and careful product selection, which is especially important on shared shopping lists.
In Spanish, please!
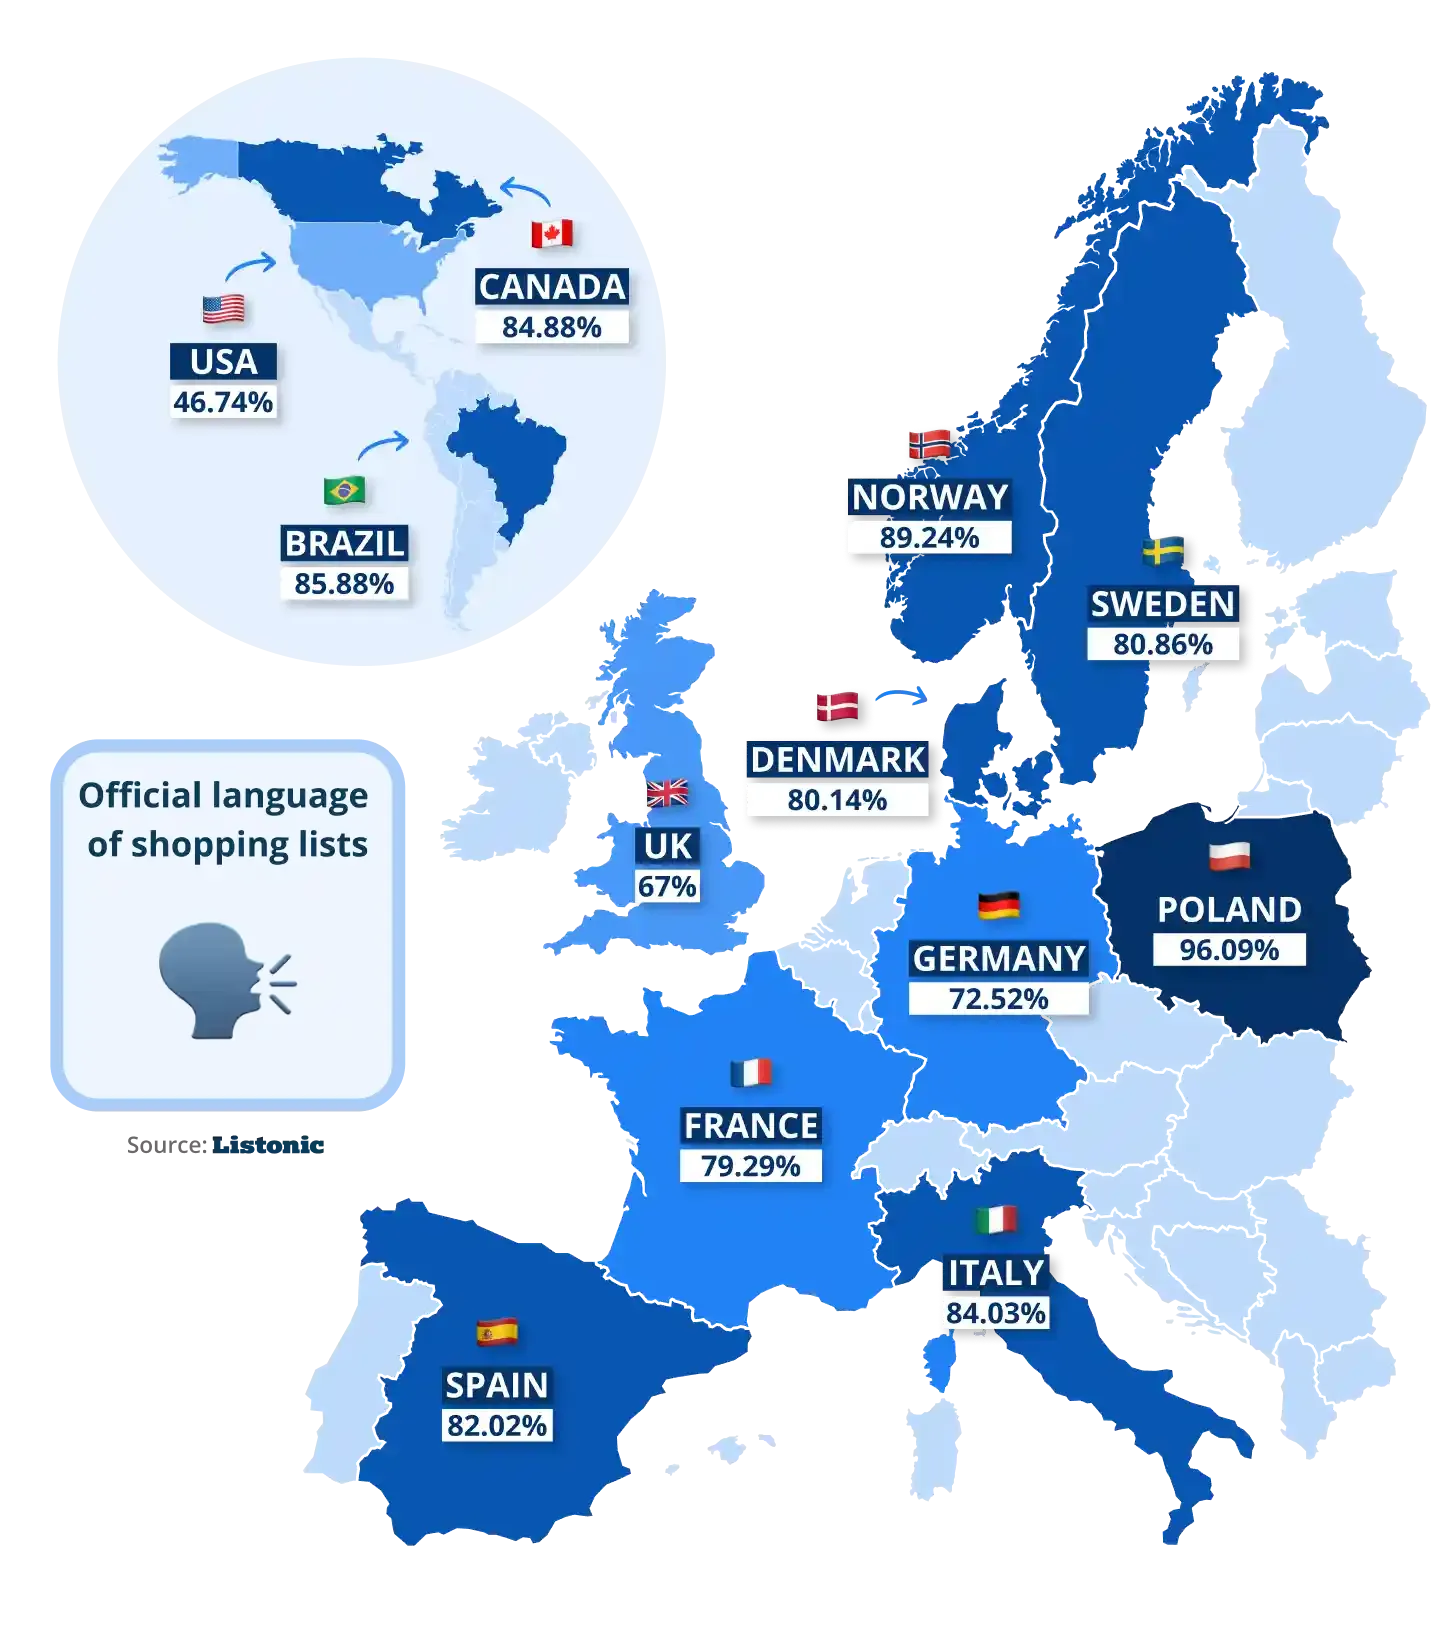
82.02% of shopping lists created between June 1, 2023, and May 31, 2024, in Spain were in Spanish, placing Spain 6th among the 12 analyzed countries.
The lowest share of the primary language was recorded in the United States, where, despite about 78.3% of residents speaking only English at home (according to American Community Survey data from 2018-2022), only 46.74% of shopping lists in the Listonic app were created in English.
Poland had the highest result (96.09%), followed by Norway (89.24%).
Shopping speed champions
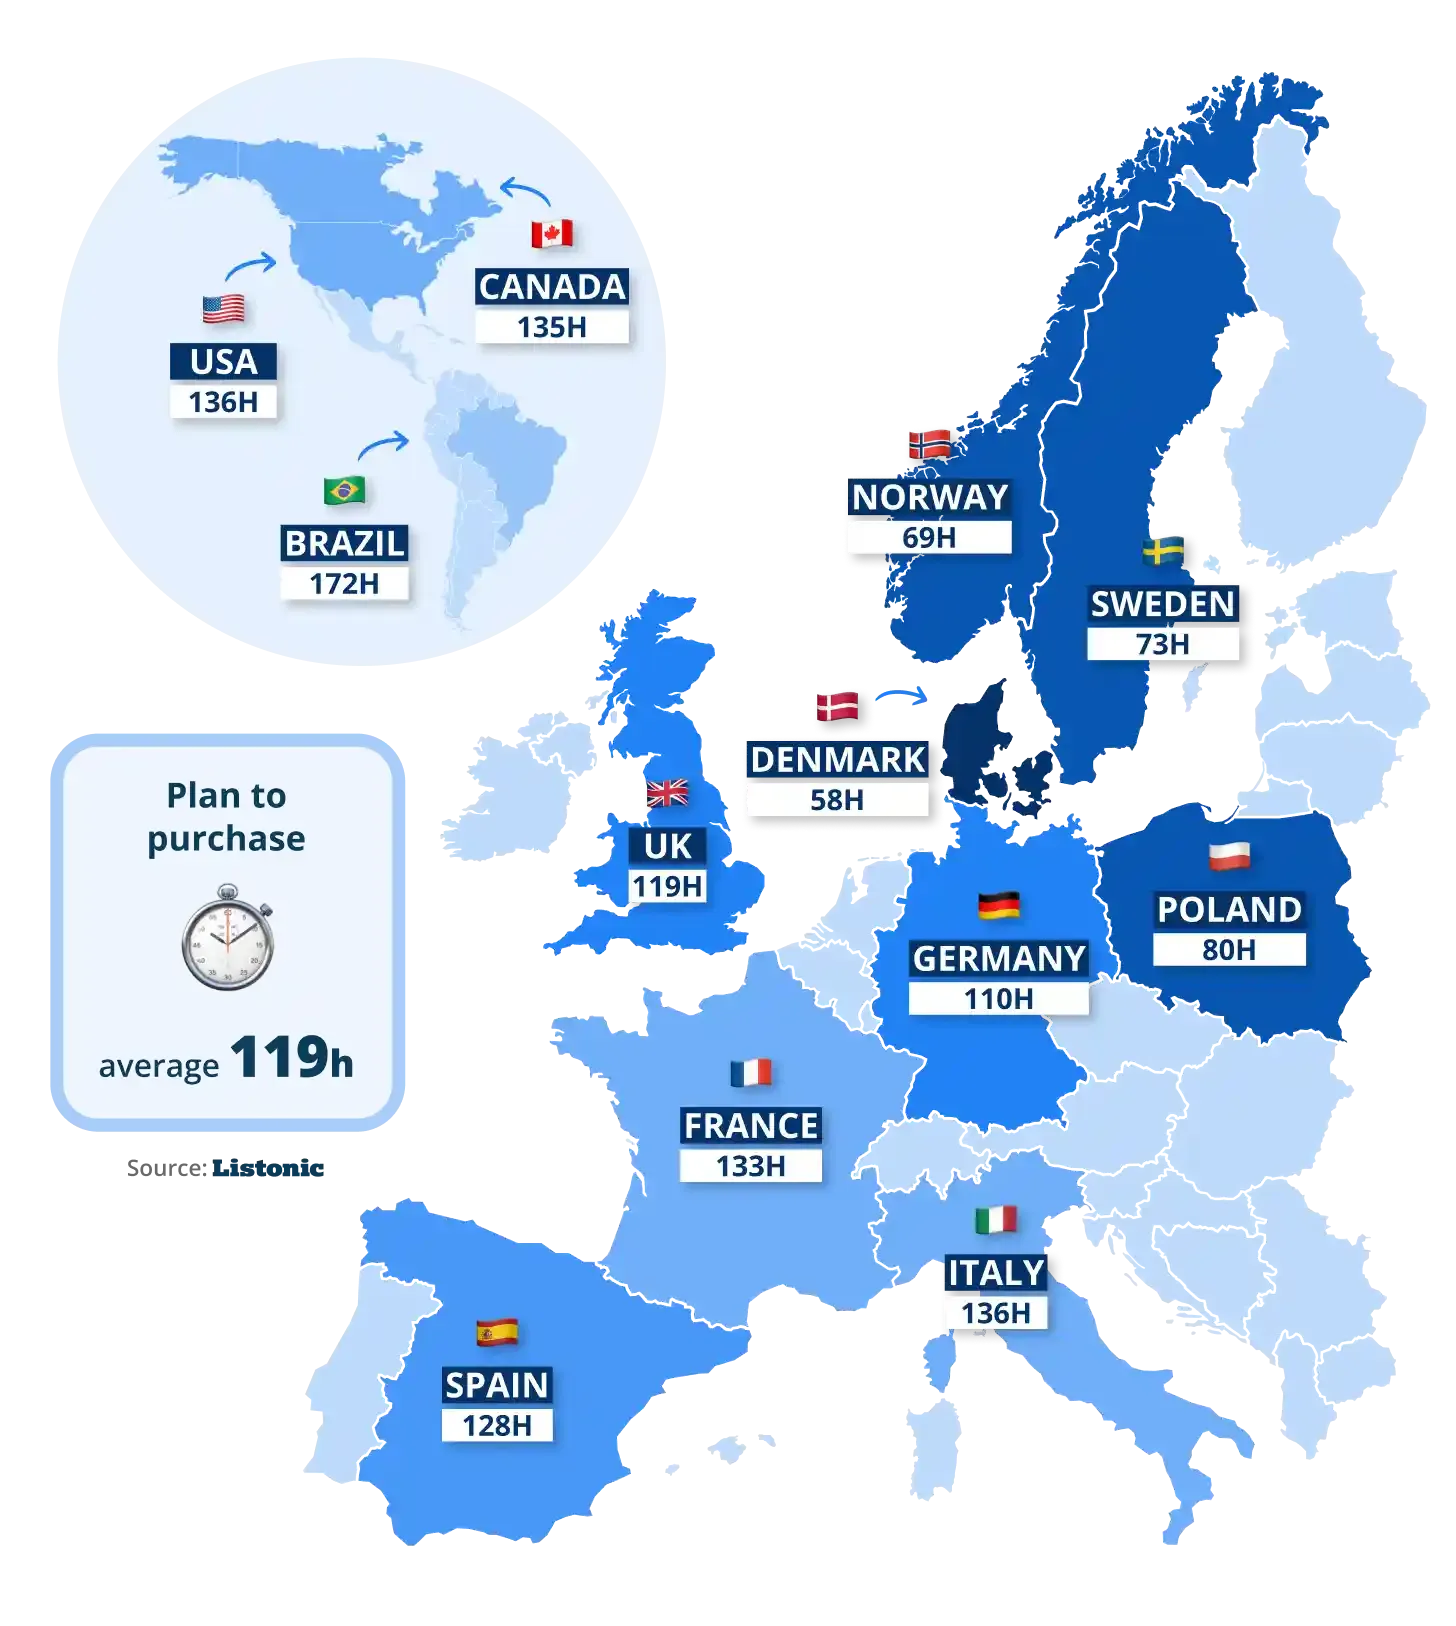
Spaniards rank 7th in the list of nations that most quickly move from adding a product to their shopping list to marking it as purchased, with an average time of 128 hours (just over 5 days).
Danes complete their shopping lists the fastest (58 hours), while Brazilians take the longest (172 hours).
Various factors, such as shopping frequency and the availability of groceries, may influence these results.
The country of ultimate organizers
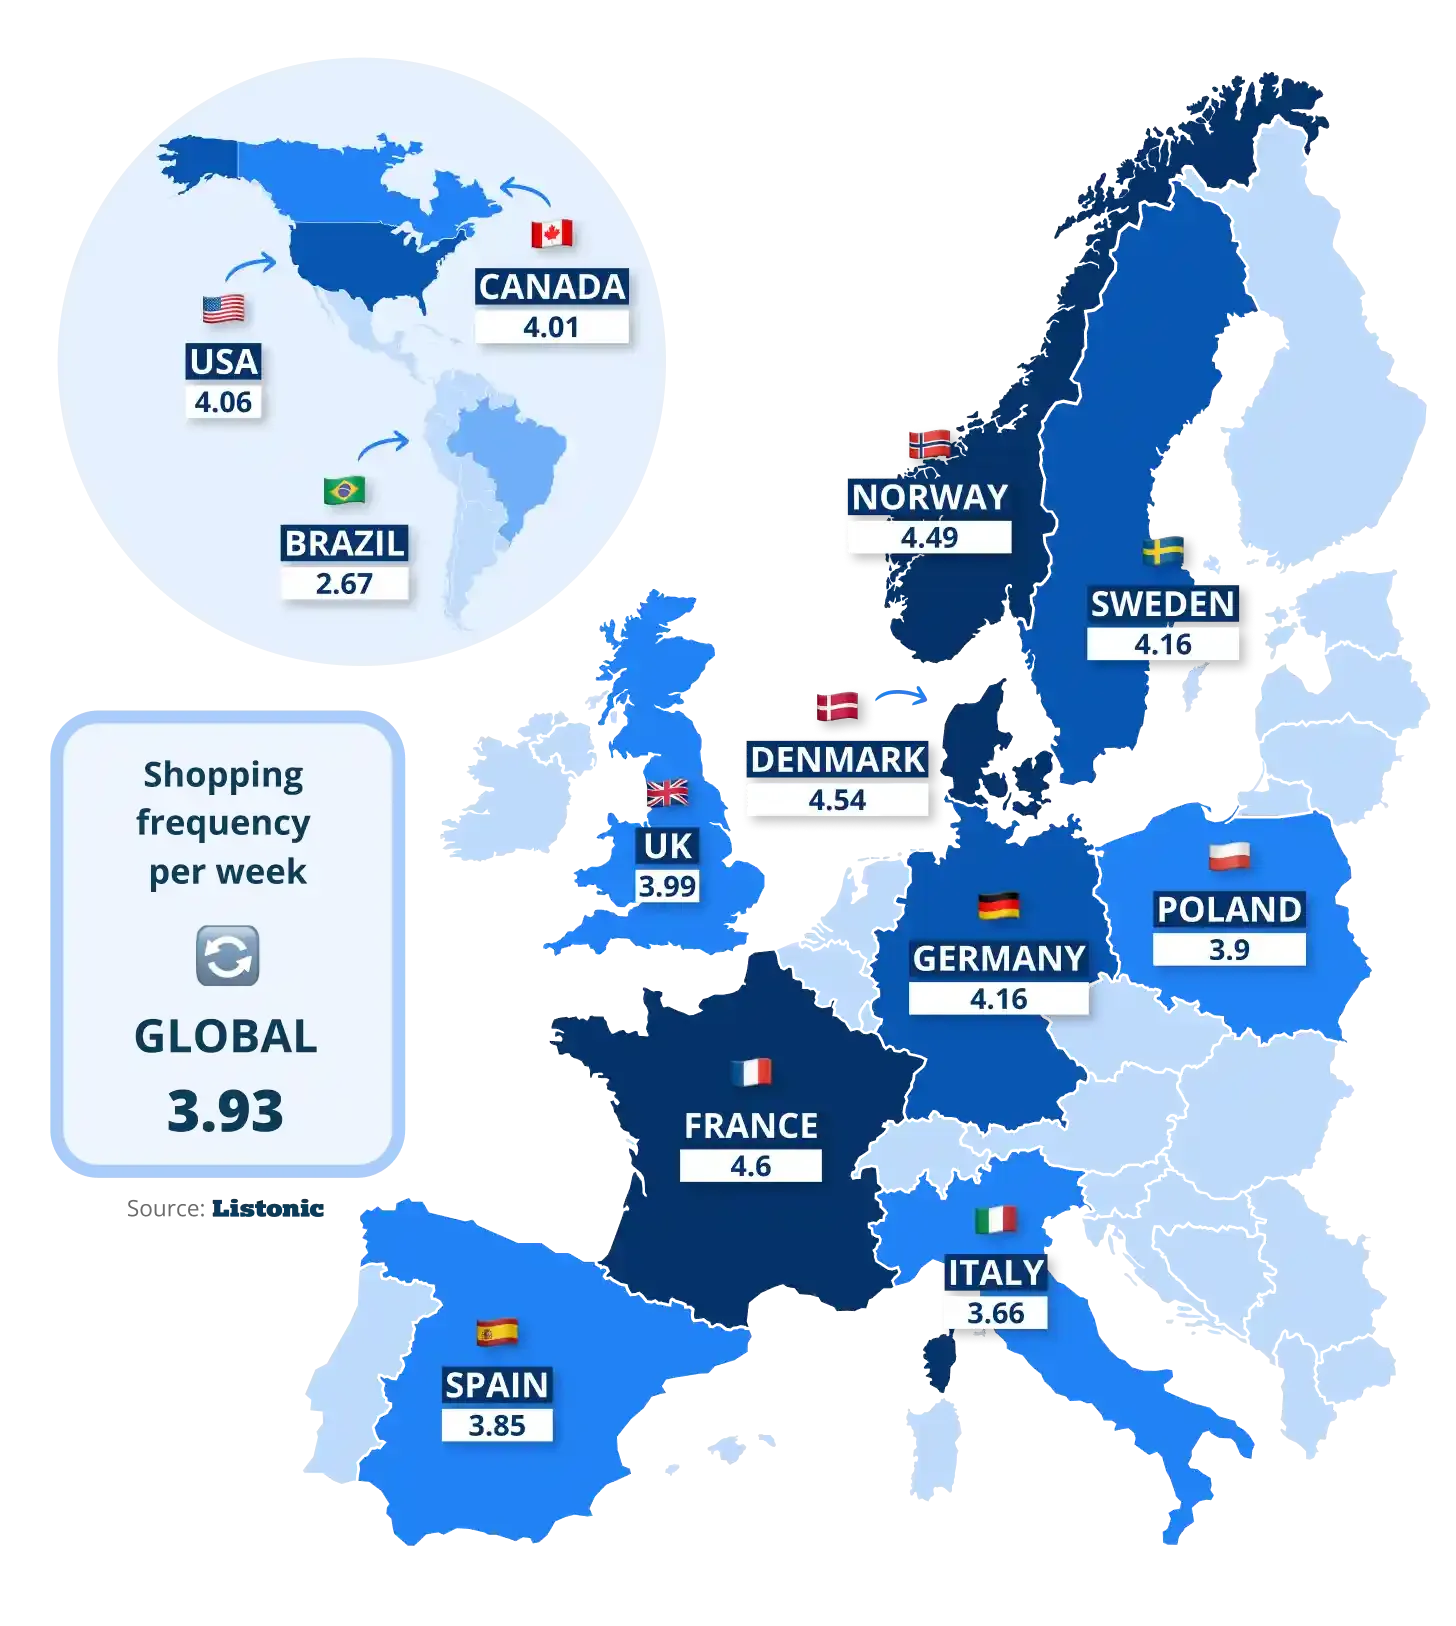
Spaniards used the Listonic app an average of 3.85 times per week, placing them near the bottom of the ranking among the analyzed countries. Only Italians and Brazilians used the app less frequently. The French used it the most (4.6 times/week), while the global average is 3.93 visits per week.
Most Spanish users (31.71%) used the app once a week, while the second-largest group (27.68%) planned their shopping 4 to 10 times per week.
The lower frequency of app use may be due to different shopping habits and lifestyles, such as frequent, spontaneous small purchases at markets, larger but less frequent shopping trips, or regular dining out.

Where do the insights come from?
The Listonic app has been downloaded over 20 million times worldwide, with more than 75,000 active users in Spain. The presented data covers shopping lists created between June 1, 2023, and May 31, 2024. During this period, 304,763 shopping lists were created in Spain, with 12,211,969 products added.
Globally, during the same period, 13,637,355 shopping lists were created, with 371,443,058 products added.
More about Listonic